
Modern AI applications are not just about generating responses anymore. As soon as LLM usage enters production, you need visibility into prompt token tracking, completion token monitoring, latency, model-level costing, and request tracing.
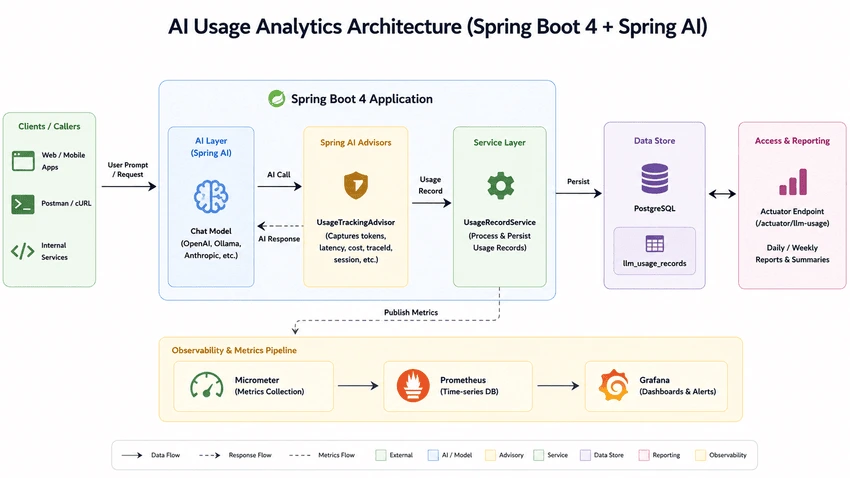
In this tutorial, we will build a lightweight AI usage analytics layer using Spring Boot 4 and Spring AI 2.0.0. The application captures:
- Prompt tokens
- Completion tokens
- Total tokens
- Latency
- Cost per request
- Model-specific usage
- Trace IDs and sessions
- Success/failure analytics
We will use Spring AI Advisors to intercept every LLM request and persist analytics into PostgreSQL.
This tutorial intentionally focuses only on the persistence and tracking layer. If you want full observability using Micrometer, Prometheus, Grafana, and Actuator metrics, read the complete guide here:
Spring AI Monitoring with Micrometer, Prometheus and Grafana
Project Overview
The goal of this application is to build a reusable analytics module for AI workloads. Instead of coupling metrics directly into controllers or services, we intercept LLM calls using Spring AI Advisors and persist structured analytics records.
This approach keeps the implementation provider agnostic and model aware. Whether you use OpenAI, Ollama, Anthropic, Gemini, or Azure OpenAI, you can centralize all llm token tracking in one place.
Local AI Infrastructure Setup
The project ships with a docker-compose.yml for running PostgreSQL and local AI infrastructure. This makes development extremely easy while experimenting with ai cost monitoring and spring ai observability.
services:

  postgres:
    image: pgvector/pgvector:pg16

    container_name: spring-ai-rag-postgres
Once the containers are up, configure Spring Boot using the following application.yaml.
spring:
  ai:
    ollama:
      base-url: http://localhost:11434
      chat:
        options:
          model: llama3.2
          temperature: 0.7
          num-ctx: 4096

  datasource:
    url: jdbc:postgresql://localhost:5432/llmtracker
    username: postgres
    password: postgres
The application is configured with:
- Ollama as the local LLM provider
- PostgreSQL for usage analytics persistence
- Batch-friendly Hibernate configuration
- Actuator endpoint exposure
Designing the Usage Analytics Schema
The heart of this implementation is the LlmUsageRecord entity. This table stores every LLM interaction along with usage metadata.
@Entity
@Table(
    name = "llm_usage_records",
    indexes = {
        @Index(name = "idx_usage_model", columnList = "model_name"),
        @Index(name = "idx_usage_app", columnList = "application_name"),
        @Index(name = "idx_usage_created", columnList = "created_at")
    }
)
public class LlmUsageRecord {
The schema captures model-aware AI usage analytics including:
- Provider and model information
- Prompt and completion token counts
- Total token usage
- Latency metrics
- Trace IDs
- Error tracking
- Cost analytics
The token-specific fields are straightforward.
@Column(name = "prompt_tokens", nullable = false)
private int promptTokens;

@Column(name = "completion_tokens", nullable = false)
private int completionTokens;

@Column(name = "total_tokens", nullable = false)
private int totalTokens;
For production systems, storing latency and status information is equally important. This helps identify slow models, overloaded providers, and failure spikes.
@Column(name = "latency_ms")
private Long latencyMs;

@Enumerated(EnumType.STRING)
@Column(name = "status", length = 16, nullable = false)
private CallStatus status = CallStatus.SUCCESS;
Model-Aware Cost Calculation
Different LLM providers have different pricing models. Some charge differently for prompt tokens and completion tokens. Others may use version-specific pricing.
Instead of hardcoding pricing inside the business logic, we externalize pricing into a dedicated table.
@Entity
@Table(
    name = "model_pricing_configs",
    uniqueConstraints = @UniqueConstraint(
        name = "uq_provider_model",
        columnNames = {"provider", "model_name"}
    )
)
public class ModelPricingConfig {
The pricing entity stores per-model token cost.
@Column(name = "prompt_cost_per_million", precision = 18, scale = 10, nullable = false)
private BigDecimal promptCostPerMillion = BigDecimal.ZERO;

@Column(name = "completion_cost_per_million", precision = 18, scale = 10, nullable = false)
private BigDecimal completionCostPerMillion = BigDecimal.ZERO;
This makes the implementation dynamic enough to support:
- OpenAI pricing
- Anthropic pricing
- Azure OpenAI pricing
- Local Ollama models
- Future model upgrades
It also becomes extremely useful for token cost analytics and long-term reporting.
Why Spring AI Advisors Are the Right Place
The most important design decision in this tutorial is using Spring AI Advisors for token tracking.
Advisors intercept the AI request lifecycle centrally. That means you can capture usage analytics without polluting your controller or service code.
This is exactly why spring ai advisors are the ideal place for implementing cross-cutting concerns like:
- AI usage analytics
- Token accounting
- Tracing
- Observability
- Security
- Rate limiting
The advisor runs after the model response is generated so that we can capture final token counts.
@Override
public int getOrder() {
    // Run last (after security advisors, RAG, etc.) so we capture final token counts
    return Integer.MAX_VALUE - 100;
}
The actual interception happens in adviseCall().
@Override
public ChatClientResponse adviseCall(ChatClientRequest chatClientRequest,
                                     CallAdvisorChain callAdvisorChain) {

    Instant start = Instant.now();

    try {
        ChatClientResponse response = callAdvisorChain.nextCall(chatClientRequest);

        long latencyMs = Instant.now().toEpochMilli() - start.toEpochMilli();

        persistLlmUsage(chatClientRequest, response, start, latencyMs,
                LlmUsageRecord.CallStatus.SUCCESS, null, null);

        return response;

    } catch (Exception ex) {

        long latencyMs = Instant.now().toEpochMilli() - start.toEpochMilli();

        persistLlmUsage(chatClientRequest, null, start, latencyMs,
                LlmUsageRecord.CallStatus.FAILURE,
                ex.getClass().getSimpleName(), ex.getMessage());

        throw ex;
    }
}
This implementation automatically captures:
- Prompt tokens
- Completion tokens
- Total tokens
- Latency
- Error status
- Model name
- Trace IDs
Spring AI exposes token usage directly through the response metadata.
ChatResponseMetadata metadata = chatResponse.getMetadata();
Usage usage = metadata.getUsage();

promptTokens = usage.getPromptTokens();
completionTokens = usage.getCompletionTokens();
totalTokens = usage.getTotalTokens();
This is the cleanest possible implementation for spring ai token usage tracking.
Streaming Caveats
For this demo, the streaming advisor intentionally returns null.
@Override
public Flux<ChatClientResponse> adviseStream(ChatClientRequest chatClientRequest,
                                             StreamAdvisorChain streamAdvisorChain) {
    return null;
}
However, streaming responses require additional considerations. In production systems, you usually want to:
- Capture first-token latency
- Track partial completion tokens
- Handle cancellation scenarios
- Persist usage after stream completion
Streaming introduces asynchronous execution semantics, so analytics persistence should generally happen after the Flux completes.
Persisting Usage Records
The persistence layer is intentionally simple. The service calculates token cost and saves the usage record.
@Transactional
public LlmUsageRecord record(UsageRecordRequest request) {

    var cost = costCalculator.calculate(
            request.provider(),
            request.modelName(),
            request.promptTokens(),
            request.completionTokens()
    );
The final entity is created with all analytics metadata.
LlmUsageRecord record = LlmUsageRecord.builder()
        .traceId(request.traceId())
        .applicationName(request.applicationName())
        .provider(request.provider())
        .modelName(request.modelName())
        .promptTokens(request.promptTokens())
        .completionTokens(request.completionTokens())
        .totalTokens(totalTokens)
        .promptCost(cost.promptCost())
        .completionCost(cost.completionCost())
        .totalCost(cost.totalCost())
        .latencyMs(request.latencyMs())
        .status(request.status())
        .build();
This architecture works well for:
- track openai token usage java
- Multi-model analytics
- Cost attribution
- Tenant-level billing
- AI governance dashboards
Performance Considerations
In high-throughput AI systems, avoid blocking database writes directly inside hot request paths.
For production-grade systems, consider:
- Async persistence
- Event-driven ingestion
- Kafka/RabbitMQ buffering
- Batch inserts
- Write-behind strategies
The current configuration already enables Hibernate batching.
hibernate:
  jdbc:
    batch_size: 50
    fetch_size: 100
This becomes important once your AI application starts handling thousands of requests per minute.
Integrating with Micrometer and Prometheus
Once usage records are persisted into PostgreSQL, integrating with Micrometer becomes straightforward.
A common approach is:
- Publish token counts into Micrometer counters
- Track latency using timers
- Tag metrics by provider and model
- Expose metrics through Spring Boot Actuator
- Scrape metrics using Prometheus
This creates a complete spring ai metrics pipeline for:
- AI usage monitoring
- Cost tracking
- Model comparison
- Operational observability
Instead of covering dashboards again in this tutorial, read the complete monitoring guide here:
Spring AI Monitoring with Micrometer, Prometheus and Grafana
Building a Custom Actuator Endpoint
The project also exposes a custom actuator endpoint for aggregated analytics.
@Component
@Endpoint(id = "llm-tracker")
@RequiredArgsConstructor
public class LlmUsageActuatorEndpoint {
The endpoint supports daily and period-based summaries.
@ReadOperation
public Map<String, Object> today() {
    LocalDate today = LocalDate.now(ZoneOffset.UTC);
    return buildSummary("today", today, today);
}
The implementation aggregates:
- Total calls
- Total tokens
- Success rate
- Total cost
- Average latency
- Per-model breakdowns
The per-model analytics are especially useful when comparing model efficiency.
var modelBreakdown = recordRepository.aggregateByModel(
        from.atStartOfDay().toInstant(ZoneOffset.UTC),
        to.plusDays(1).atStartOfDay().toInstant(ZoneOffset.UTC)
);
You can expose summaries like:
- Daily reports
- Weekly reports
- 30-day AI spend reports
- Model usage leaderboards
This gives you a lightweight analytics layer before moving into full-scale observability dashboards.
Conclusion
In this tutorial, we built a reusable AI analytics layer using:
- Spring Boot 4
- Spring AI 2.0.0
- Spring AI Advisors
- PostgreSQL
- Custom Actuator endpoints
The implementation captures:
- Prompt token tracking
- Completion token monitoring
- Latency analytics
- AI cost monitoring
- Traceable usage analytics
The complete source code can be found at Github here.
This architecture provides a solid foundation for scaling into:
- Micrometer metrics
- Prometheus scraping
- Grafana dashboards
- AI billing systems
- Enterprise observability platforms
In the next step, you can wire these usage records into Micrometer registries and visualize them using Prometheus and Grafana.
