
When building real-world AI applications, generating responses using LLMs is just the beginning. The real challenge starts when the application goes into production - how to monitor token usage, control cost, and ensure observability?
In this article, we will build a LLM usage monitoring system using Spring Boot and Spring AI. This includes:
- Token usage tracking (prompt + completion)
- Response time monitoring
- Billing-ready persistence layer
- Decorator pattern (no AOP surprises)
- Async and scalable architecture
We have already built below Spring AI apps in our previous articles and hence let's directly jump into building this app from there.
- Build AI Chat App with Spring AI and Redis
- RAG with Ollama, Spring AI, and ChromaDB
- Build AI Knowledge Assistant with Spring AI
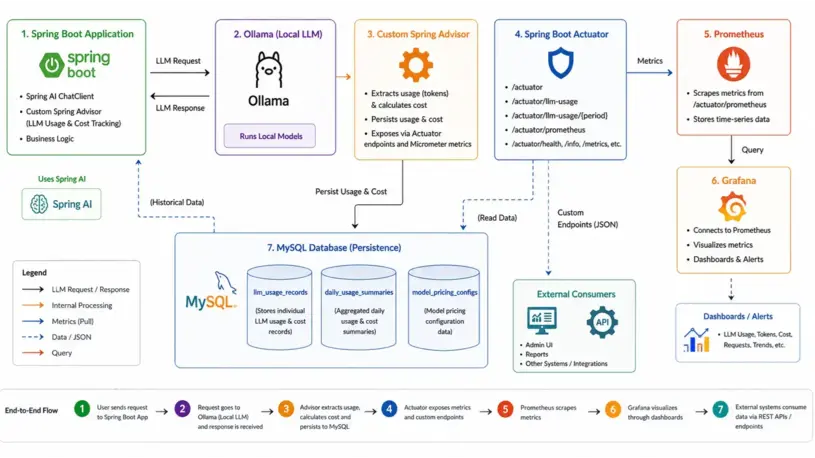
Architecture Overview of the Monitoring System
High-level flow:
- Spring AI -> generates responses
- Custom Advisor -> captures usage
- MySQL -> persists usage + cost
- Micrometer -> records metrics
- Actuator -> exposes metrics endpoint
- Prometheus -> scrapes metrics
Setting Up Spring Boot with Spring AI and Micrometer
Maven Dependencies
<dependency>
    <groupId>org.springframework.boot</groupId>
    <artifactId>spring-boot-starter-data-jpa</artifactId>
</dependency>

<dependency>
    <groupId>org.springframework.boot</groupId>
    <artifactId>spring-boot-starter-actuator</artifactId>
</dependency>

<dependency>
    <groupId>io.micrometer</groupId>
    <artifactId>micrometer-registry-prometheus</artifactId>
    <scope>runtime</scope>
</dependency>

<dependency>
    <groupId>org.springframework.ai</groupId>
    <artifactId>spring-ai-starter-model-ollama</artifactId>
</dependency>
micrometer-registry-prometheus: It's used to export application metrics to Prometheus.
Application.yaml Config
Here is the yaml config for individual components:
LLM Model Config
spring:
  ai:
	ollama:
	  base-url: http://localhost:11434
	  chat:
		options:
		  model: llama3.2
		  temperature: 0.7
		  num-ctx: 4096
	  embedding:
		options:
		  model: nomic-embed-text
	  init:
		pull-model-strategy: never
		timeout: 60s
Spring Boot Actuator Config
management:
  endpoints:
	web:
	  exposure:
		include:
		  - health          #http://localhost:8080/actuator/health
		  - info
		  - metrics
		  - prometheus
		  - llm-usage
	  base-path: /actuator
  endpoint:
	health:
	  show-details: always
	prometheus:
	  enabled: true
	llm-usage:
	  enabled: true
  metrics:
	export:
	  prometheus:
		enabled: true
	tags:
	  application: ${spring.application.name}
/actuator/prometheus: Exposes all metrics collected via Micrometer and formats them in Prometheus text format.
/actuator/llm-usage: Returns aggregated LLM usage + cost data backed by MySQL tables.
DB Structure for Token Usage Records
We have 2 main tables for capturing the token(llm_usage_records) and cost(model_pricing_configs) usage. The third table daily_usage_summaries is for generating daily summary.
create table daily_usage_summaries (id bigint not null auto_increment, application_name varchar(128) not null, avg_latency_ms float(53), failed_calls bigint not null, last_computed_at datetime(6), model_name varchar(128) not null, p95_latency_ms bigint, p99_latency_ms bigint, provider varchar(64) not null, successful_calls bigint not null, summary_date date not null, total_calls bigint not null, total_completion_tokens bigint not null, total_cost decimal(18,10), total_prompt_tokens bigint not null, total_tokens bigint not null, primary key (id)) engine=InnoDB

create table llm_usage_records (id bigint not null auto_increment, application_name varchar(128) not null, completion_cost decimal(18,10), completion_tokens integer not null, created_at datetime(6) not null, currency varchar(8), endpoint varchar(256), error_code varchar(64), error_message varchar(512), first_token_latency_ms bigint, latency_ms bigint, model_name varchar(128) not null, model_version varchar(64), operation_type enum ('CHAT','COMPLETION','EMBEDDING','IMAGE_GENERATION','SPEECH_TO_TEXT','TEXT_TO_SPEECH') not null, prompt_cost decimal(18,10), prompt_tokens integer not null, provider varchar(64) not null, request_completed_at datetime(6), request_id varchar(64), request_started_at datetime(6), session_id varchar(128), status enum ('FAILURE','RATE_LIMITED','SUCCESS','TIMEOUT') not null, tags varchar(512), total_cost decimal(18,10), total_tokens integer not null, trace_id varchar(64), user_id varchar(128), primary key (id)) engine=InnoDB

create table model_pricing_configs (id bigint not null auto_increment, is_active bit, completion_cost_per_million decimal(18,10) not null, created_at datetime(6), currency varchar(8), display_name varchar(256), model_name varchar(128) not null, notes varchar(512), prompt_cost_per_million decimal(18,10) not null, provider varchar(64) not null, updated_at datetime(6), primary key (id)) engine=InnoDB
Spring AI Chat Client
Wires the UsageTrackingAdvisor into the default ChatClient bean. Any code that injects ChatClient will automatically have token usage tracked and persisted without any extra boilerplate.
@Bean
public ChatClient chatClient(OllamaChatModel chatModel, UsageTrackingAdvisor usageTrackingAdvisor) {
	return ChatClient.builder(chatModel)
			.defaultAdvisors(usageTrackingAdvisor)
			.build();
}
Callers can pass context for richer tracking via adviseContext such as llm.tracker.applicationName, llm.tracker.traceId, etc.
public ChatResponse chat(ChatRequest request) {

String answer = chatClient.prompt()
		.user(request.getMessage())
		.advisors(a -> a
				.param("llm.tracker.applicationName", "knowledge-service")
				.param("llm.tracker.userId", "dummy123")
				.param("llm.tracker.traceId", tracer.currentSpan().context().traceId()))
		.call()
		.content();

return ChatResponse.builder()
		.answer(answer)
		.conversationId(request.getConversationId())
		.timestamp(Instant.now())
		.build();
}
Capturing Token Usage and Latency Metrics
Use a custom advisor to capture response metadata:
public class UsageTrackingAdvisor implements CallAdvisor, StreamAdvisor {

@Override
public int getOrder() {
	// Run last (after security advisors, RAG, etc.) so we capture final token counts
	return Integer.MAX_VALUE - 100;
}

@Override
public ChatClientResponse adviseCall(ChatClientRequest chatClientRequest, CallAdvisorChain callAdvisorChain) {
	Instant start = Instant.now();
	try {
		ChatClientResponse response = callAdvisorChain.nextCall(chatClientRequest);
		long latencyMs = Instant.now().toEpochMilli() - start.toEpochMilli();
		persistLlmUsage(chatClientRequest, response, start, latencyMs,
				LlmUsageRecord.CallStatus.SUCCESS, null, null);
		return response;
	} catch (Exception ex) {
		long latencyMs = Instant.now().toEpochMilli() - start.toEpochMilli();
		persistLlmUsage(chatClientRequest, null, start, latencyMs,
				LlmUsageRecord.CallStatus.FAILURE, ex.getClass().getSimpleName(), ex.getMessage());
		throw ex;
	}
}
Extracting Usage and Token Metrics
Let's extract the prompt tokens, completion tokens usage and other metadata from Spring's ChatClientRequest and ChatClientResponse.
private void persistLlmUsage(ChatClientRequest request, ChatClientResponse response) {

    String appName = (String) request.context().getOrDefault(APPLICATION_NAME_KEY, "unknown");
    String userId = (String) request.context().get(USER_ID_KEY);
    String traceId = (String) request.context().get(TRACE_ID_KEY);

    try {
        int promptTokens = 0;
        int completionTokens = 0;
        int totalTokens = 0;
        String modelName = null;
        var chatResponse = response.chatResponse();
        if (chatResponse != null) {
            modelName = chatResponse.getMetadata().getModel();
            ChatResponseMetadata metadata = chatResponse.getMetadata();
            Usage usage = metadata.getUsage();
            promptTokens = usage.getPromptTokens();
            completionTokens = usage.getCompletionTokens();
            totalTokens = usage.getTotalTokens();
        }
        //Build the UsageRecordRequest record
        usageRecordService.record(usageRequest);
Tracking Cost with Custom Model Pricing
The TokenCostcalculator service calculates cost for a given provider/model and token counts based on the config available in the table model_pricing_configs
public CostBreakdown calculate(String provider, String modelName, int promptTokens, int completionTokens) {
	Optional<ModelPricingConfig> config = getPricingConfig(provider, modelName);

	ModelPricingConfig pricing = config.get();

	BigDecimal promptCost = BigDecimal.valueOf(promptTokens)
			.multiply(pricing.getPromptCostPerMillion(), PRECISION)
			.divide(ONE_MILLION, 10, RoundingMode.HALF_UP);

	BigDecimal completionCost = BigDecimal.valueOf(completionTokens)
			.multiply(pricing.getCompletionCostPerMillion(), PRECISION)
			.divide(ONE_MILLION, 10, RoundingMode.HALF_UP);

	BigDecimal totalCost = promptCost.add(completionCost).setScale(10, RoundingMode.HALF_UP);

	return new CostBreakdown(promptCost, completionCost, totalCost, pricing.getCurrency());
}
The usageRecordService finally persists the token usage with the calculated cost into DB.
public class UsageRecordService {

private final LlmUsageRecordRepository recordRepository;
private final TokenCostCalculator costCalculator;
private final LlmMetricsService metricsService;

@Transactional
public LlmUsageRecord record(UsageRecordRequest request) {
	// Compute cost from stored pricing config
	var cost = costCalculator.calculate(
			request.provider(),
			request.modelName(),
			request.promptTokens(),
			request.completionTokens()
	);
	//Convert UsageRecordRequest to LlmUsageRecord
	LlmUsageRecord saved = recordRepository.save(record);

	// Update Micrometer metrics
	metricsService.recordUsage(saved);
}
Integrating Micrometer for Metrics Collection
@Autowired
MeterRegistry meterRegistry;

meterRegistry.counter("llm.tokens.input").increment(inputTokens);
meterRegistry.counter("llm.tokens.output").increment(outputTokens);
meterRegistry.timer("llm.latency").record(latency, TimeUnit.MILLISECONDS);
Exposing Metrics via Spring Boot Actuator
This actuator endpoint can be accessed through Http call.
http://localhost:8080/actuator/llm-usage
@Component
@Endpoint(id = "llm-usage")
@RequiredArgsConstructor
public class LlmUsageActuatorEndpoint {

    private final DailyUsageSummaryRepository summaryRepository;
    private final LlmUsageRecordRepository recordRepository;

    @ReadOperation
    public Map<String, Object> today() {
        LocalDate today = LocalDate.now(ZoneOffset.UTC);
        return buildSummary("today", today, today);
    }
}
Build summary will pull the saved summary from the DB.
private Map<String, Object> buildSummary(String label, LocalDate from, LocalDate to) {
	var summaries = summaryRepository.findBySummaryDateBetweenOrderBySummaryDateAsc(from, to);

	long totalCalls    = summaries.stream().mapToLong(s -> s.getTotalCalls()).sum();
	long totalTokens   = summaries.stream().mapToLong(s -> s.getTotalTokens()).sum();
	long successCalls  = summaries.stream().mapToLong(s -> s.getSuccessfulCalls()).sum();
	long failedCalls   = summaries.stream().mapToLong(s -> s.getFailedCalls()).sum();
	BigDecimal cost    = summaryRepository.sumTotalCost(from, to, null);

	double avgLatency  = summaries.stream()
			.filter(s -> s.getAvgLatencyMs() != null)
			.mapToDouble(s -> s.getAvgLatencyMs())
			.average().orElse(0.0);

	// Per-model breakdown
	var modelBreakdown = recordRepository.aggregateByModel(
			from.atStartOfDay().toInstant(ZoneOffset.UTC),
			to.plusDays(1).atStartOfDay().toInstant(ZoneOffset.UTC)
	);
	//...
}
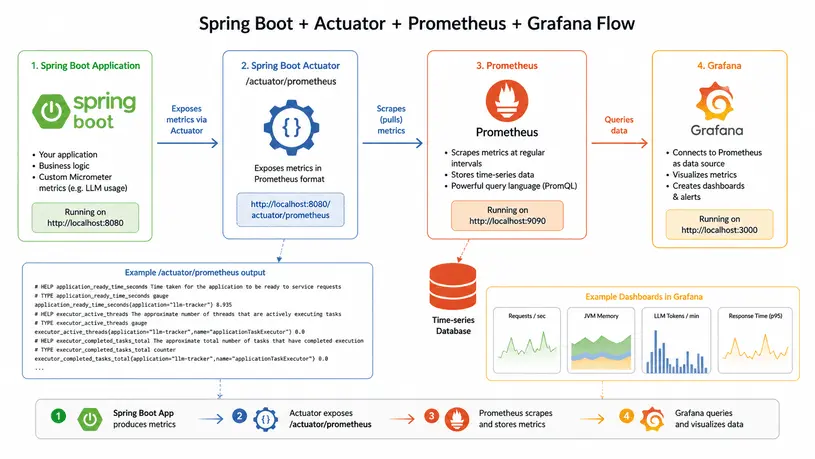
Access metrics:
http://localhost:8080/actuator/prometheusVisualizing Metrics in Prometheus
scrape_configs:
  - job_name: 'knowledge-service'
    metrics_path: '/actuator/prometheus'
    static_configs:
      - targets: ['localhost:8080']
This visualization flow foes like this:
Putting It All Together
Now our system:
- Captures token usage and latency
- Calculates cost dynamically
- Exports metrics via Actuator
- Visualizes via Prometheus
- Persists data in MySQL
This setup gives you full visibility into LLM usage and cost, making our Spring AI application production-ready.
